Seeing the Bigger Picture (3)
Understanding credit expansion and contraction
This series on “Seeing the Bigger Picture” has looked at exactly the same scenario — same people, same actions — but from different perspectives. In the first, there were 3 diagrams, showing the actions taking place in 3 separate periods of time. In the second, there were 7 diagrams, each showing all of the actions which involve either a single tangible asset or a single debt.
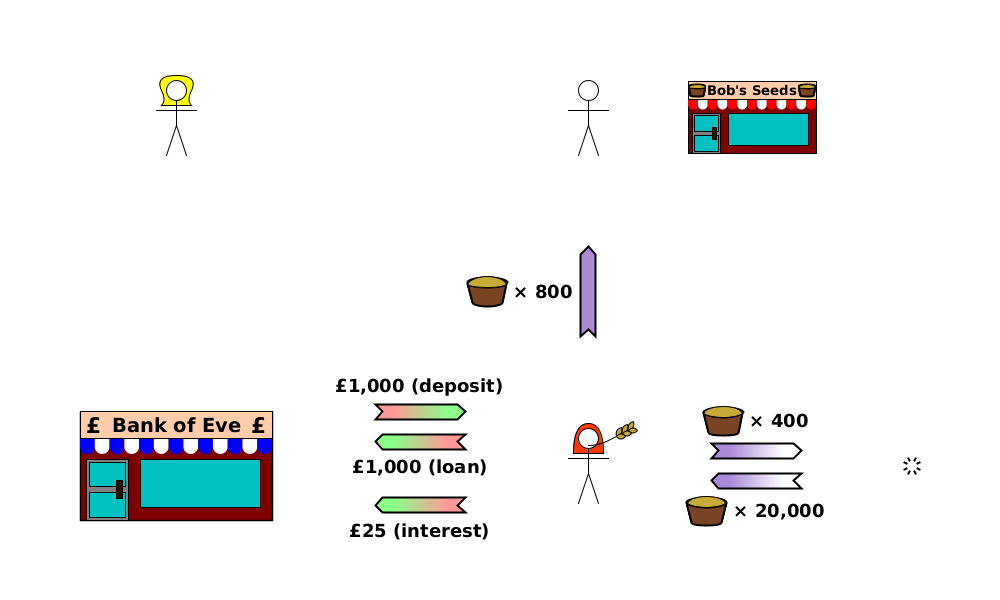
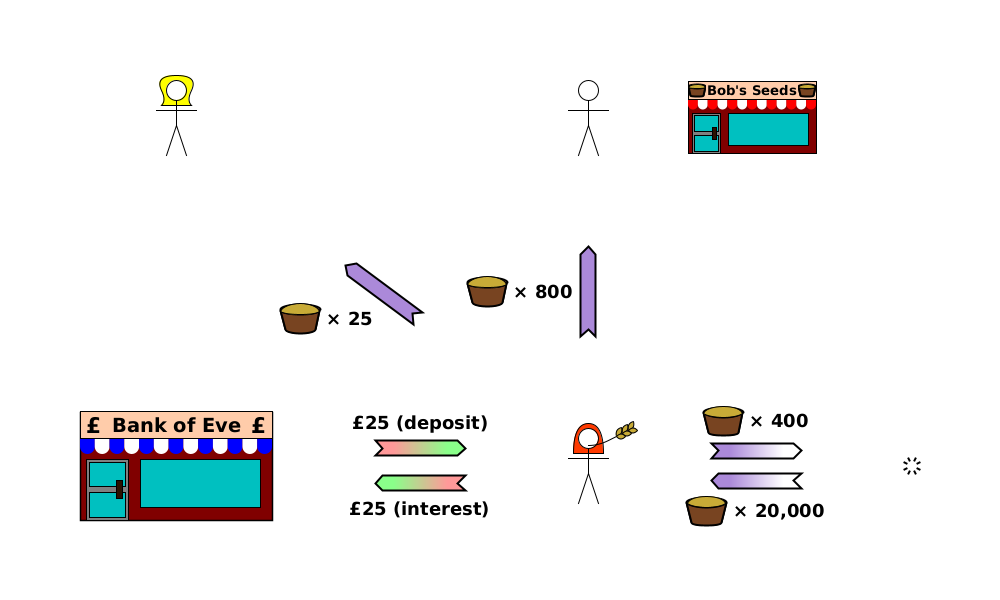
This week, we’ll see the same scenario from a third perspective. Here there are 9 diagrams, one for each of the transactions in the scenario. But instead of just showing the actions for the transaction itself, each diagram shows the cumulative effect of all of the actions from the start of the scenario up to (and including) that transaction, so we can see at a glance what’s changed since the start. The diagrams are also simplified using the idea of “resultant” actions from last week’s article: where multiple actions are equivalent to a single resultant action, the diagram shows just the resultant action.
Make sure you examine the diagrams carefully and understand what each of the arrows means for what everyone owns, is owed and owes (and therefore their raw net worth1). While you’re doing this, look out in particular for three things:
The world’s raw net worth increasing or decreasing.
The total quantity of money increasing or decreasing. (Look for bank-created money, labelled “deposits”).
The complexity of the diagram increasing or decreasing.
Make some notes as you look through them, and check at the end whether you agree with me.
(1) Alice borrows
(2) Alice buys extra seeds
This diagram has the first “resultant” action. Alice has transferred the £1,000 deposit to Bob. It’s the same result as if there had been a 3-way transaction:
The bank creates a £1,000 deposit for Bob.
Bob gives 200 bushels of seeds to Alice.
Alice promises to pay the bank £1,025 in the future.
(3) Alice sows seeds
Notice the consumption arrow on the right.
(4) Alice harvests seeds
On the right, the diagram shows Alice harvesting 20,000 bushels of wheat.
(5) Alice sells seeds to Bob
Notice in particular how Bob’s RNW has changed since the beginning of the scenario, after he buys 1,000 bushels of wheat from Alice. (Look at the arrows pointing towards and away from him). Also notice how the arrows between the bank and Alice are just like they were when she first borrowed from the bank.
(6) Alice repays loan
Notice at this point how Alice’s RNW has changed in total.
(7) Bank pays Eve a dividend
The only change here is the new deposit being created by the bank for its shareholder, Eve.
(8) Eve buys seeds from Alice
Notice how the deposit created by the bank for Eve is now owed to Alice, as though it had been created for her in the first place.
(9) Alice pays interest
Over the whole scenario, the 16 economic actions boil down to just these 4.
Production and consumption
Consumption (of 400 bushels of seeds) occurs in transaction 3. This is the only point where the world’s RNW decreases.
Production (of 20,000 bushels of seeds) occurs in transaction 4. This is the only point where the world’s RNW increases.
All other actions just transfer some of one person’s RNW to someone else.
Jean-Baptiste Say called this type of consumption in transaction 3, where it’s done to produce more than is consumed in the process, reproductive consumption2. Alice’s hope and expectation at that point is that the plants will produce more wheat seeds than she started with. This is in fact the whole point of this entire scenario.
Expansion and contraction
There are actually two expansions and two contractions.
The main expansion (by £1,000) happens in transaction 1, when the bank creates a £1,000 deposit for Alice in exchange for her promising to pay it £1,025 later.
The corresponding contraction occurs when Alice writes off this deposit (i.e. her bank balance decreases by £1,000) in exchange for the bank writing off her loan debt to it in transaction 6.
There’s a much smaller expansion (by £25) when the bank pays Eve a dividend by creating a £25 deposit for her.
And the contraction corresponding to that occurs when Alice writes off this deposit in exchange for the bank writing off her interest debt to it in transaction 9.
Complexity
Notice that the peak of complexity (with the most resultant actions) in the diagrams isn’t at the end, but at various points in the middle. Complexity increases in the credit expansion, and decreases again as those debts are written off in credit contraction, leaving behind just the real economy actions related to goods and services.
Overview of the economy
You can think of the whole economy as consisting of an enormous number of scenarios like this one, but in which Bob is replaced with the entire rest of the world. A borrower:
wants money to buy something from the rest of the world before selling anything,
borrows from a lender,
spends the money,
produces something to sell, or sells something they already have, to get money,
repays the loan plus interest.
Each scenario has a credit expansion followed by a credit contraction. The whole economy is just the superposition of all of these scenarios (a term from physics, meaning the sum of all of the individual parts). Every completed scenario boils down to barter, where all the actions are from the real economy (white and/or purple arrows). The incomplete scenarios still have outstanding debts (pink and/or green arrows).
Whether credit is expanding or contracting in total depends on whether more new scenarios are starting than old ones are ending. But each scenario follows the same sequence: expansion followed by contraction. Increasing the rate of credit expansion now can make a short-term difference, but it will increase the amount of credit contraction due to occur in future. That might be fine, but what’s important is that everyone is left satisfied with the state of the real economy once all of the debts have been settled.
I’m constantly amazed at how the approach of using economic actions can make often misunderstood topics such as credit expansion and contraction so much easier to understand. I hope you’ve found this helpful too.
Someone’s raw net worth (RNW) is what they own plus what they’re owed minus what they owe (i.e. their assets minus their liabilities). It is a “heterogeneous” sum/difference, which just means that things of different types are added and subtracted, not monetary “values” which have been assigned to them.
It’s in section 6, but unfortunately the links at the top of the page are broken, so search for “On the Formation of Capital”.


Alice seems to be giving Bob 800b of wheat for nothing. That should be 1,000b and worth £1,000 to Alice.